503 Backend Fetch Failed - if you ever used Varnish, most probably you will be familiar with this error message.
It can be a headache to determine what causes these issues.
In the following guide, I will give you some tools which will help to determine and eliminate these error messages.
How do Varnish transactions work? #
It’s important to understand if a request is going through Varnish it will show two different transaction types in the logs.
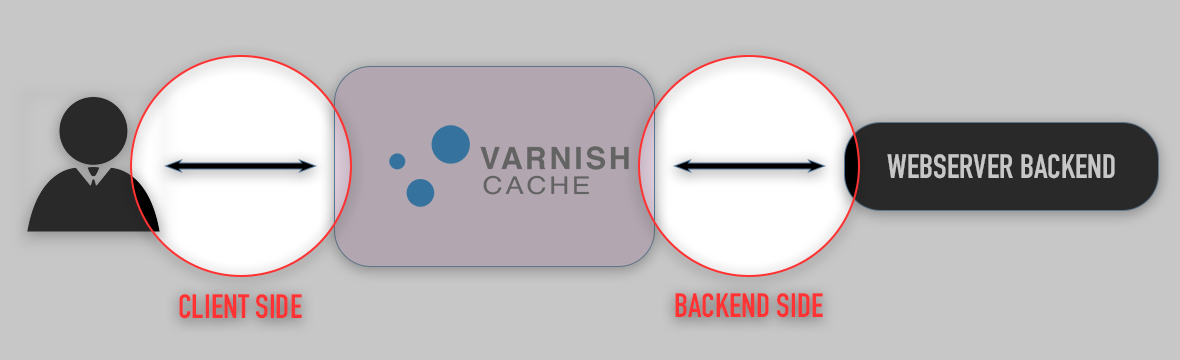
Varnish communicates in two directions. It communicates with the client (client mode) and it also communicates with the backend (backend mode). Varnish’s logging tools provide separate functionalities for these separate transaction flows. Sometimes if you can’t find the issue on one side, you will find the answer on the other side.
The tools we have #
First of all, Varnish provides really good tools for debugging but on first sight it can be hard to understand how do they work. Namely these are varnishlog, varnishncsa, varnishhist, varnishstat, and varnishtop. Let’s take a look at each of them.
Varnishlog #
The main and most advanced tool to see what’s happening inside Varnish. You can simply invoke the varnishlog command in most of the cases and you will already see useful information, but it also provides some great command-line flags if you want to get more details.
Group requests #
You can group the logs by the session, requests, vxid or you can see the raw results.
varnishlog -g raw
Display Client or Backend transactions #
It can be useful to show only the Backend transactions if you want to see why Varnish throws a 503 - Backend fetch failed error.
varnishlog -b
Query/Filter the results #
You can also limit the shown logs. For example, if you implemented a health check and Kubernetes will ping varnish every 3 sec, it will just spam your screen.
varnishlog -q 'ReqURL ne "/healthcheck"'
Another use-case can be to show only the requests which end up with 50x Error messages.
varnishlog -q 'RespStatus >= 500 or BerespStatus >= 500"'
Display only specific fields #
If you find that varnishlog is too spammy, you can select specific tags to be displayed.
varnishlog -i 'FetchError,BerespStatus,BerespReason'
...
*   << BeReq    >> 45940878
-   BerespStatus   200
-   BerespReason   OK
...
Varnishncsa #
The varnishncsa tool is something similar to varnishlog, but using it you can specify the output format. Eg.: you can generate JSON output which can be extremely useful in various use-cases (eg.: Google Cloud Platform Logs Explorer).
Most of the flags which are available for varnishlog can be also used for varnishncsa.
You can also display all the HTTP Request/Response Headers. This can also be really helpful in some cases.
https://varnish-cache.org/docs/trunk/reference/varnishncsa.html#format
Useful formatting options #
Request Headers:        %{X}i
  Eg: X-Forwarded For:  %{x-forwarded-for}i

Response Header:        %{X}o
  Eg: X-Magento-Tags:   %{x-magento-tags}o

Extended Variables:     %{X}x
  Examples:
    Varnish Vars:       %{Varnish:handling}x
                        %{Varnish:hitmiss}x
    VCL Logs:           %{VCL_Log:key}x
    VSL Tags:           %{VSL:RespReason}x
                        %{VSL:FetchError}x
Client side logs #
varnishncsa -F '{"Timestamp": "%t", "Varnish-Side": "%{Varnish:side}x", "Age": %{age}o, "Handling": "%{Varnish:handling}x", "Request": "%r", "Status": "%s", "Response-Reason": "%{VSL:RespReason}x", "Fetch-Error": "%{VSL:FetchError}x", "X-Forwarded-For": "%{x-forwarded-for}i", "Remote-User": "%u", "Bytes": "%b", "Time-To-Serve": %D, "User-Agent": "%{User-agent}i", "Referer": "%{Referer}i", "X-Varnish": "%{x-varnish}o", "X-Magento-Tags": "%{x-magento-tags}o"}}'
Backend side logs #
varnishncsa -b -F '{"Timestamp": "%t", "Varnish-Side": "%{Varnish:side}x", "Handling": "%{Varnish:handling}x", "Request": "%r", "Status": "%s", "Response-Reason": "%{VSL:RespReason}x", "Fetch-Error": "%{VSL:FetchError}x", "Bytes": "%b", "Time-To-Serve": %D}'
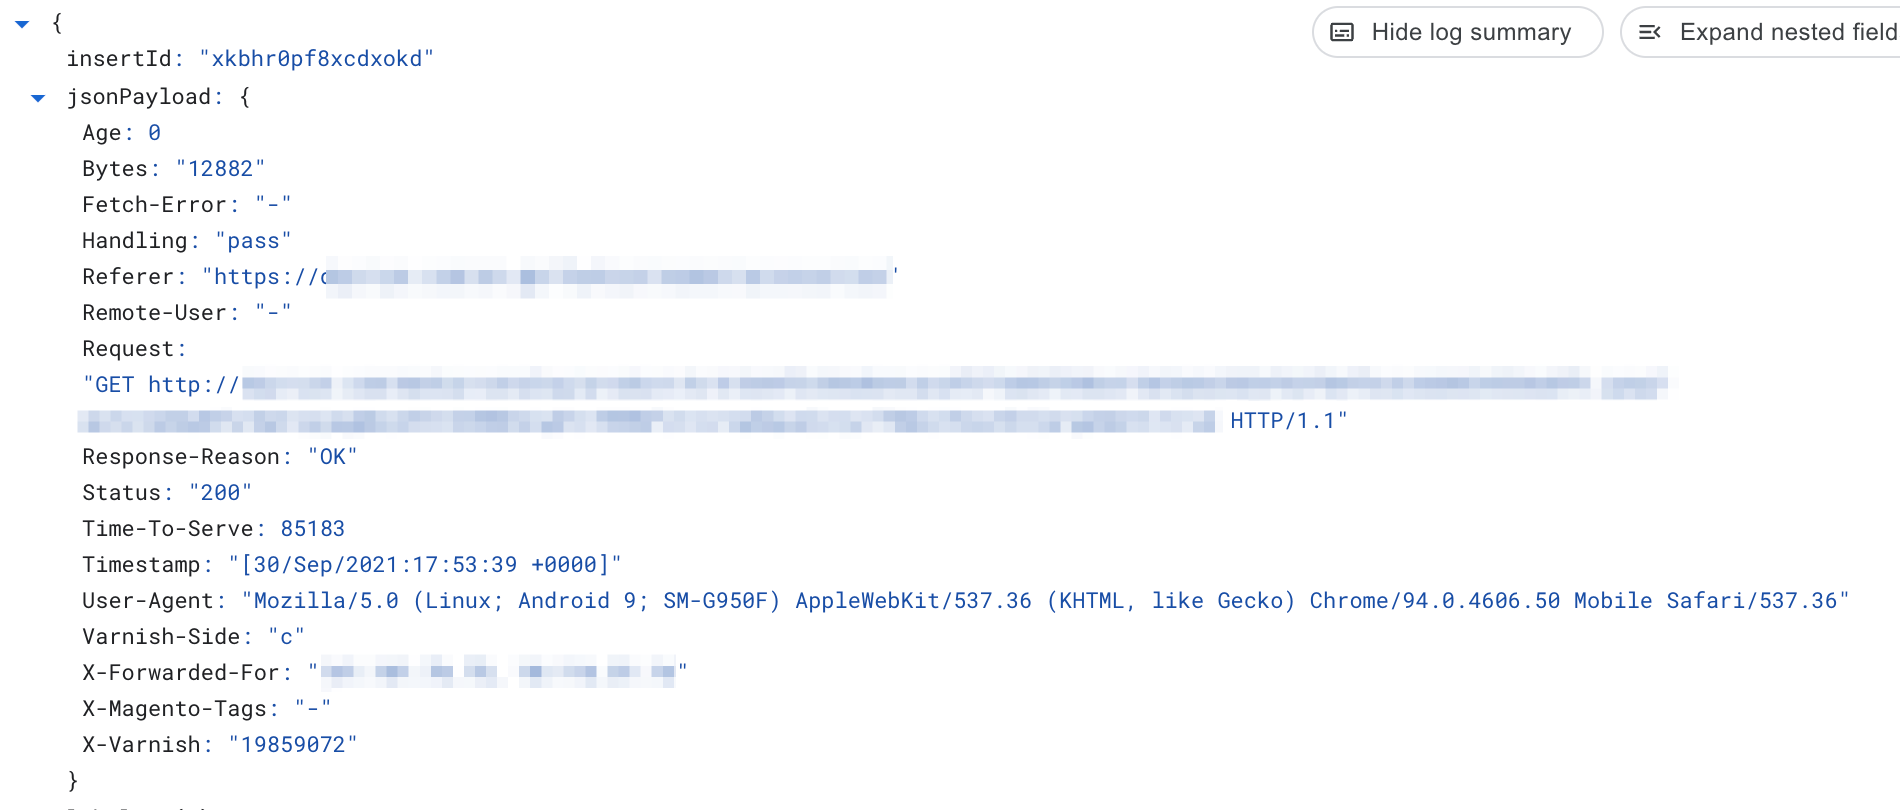
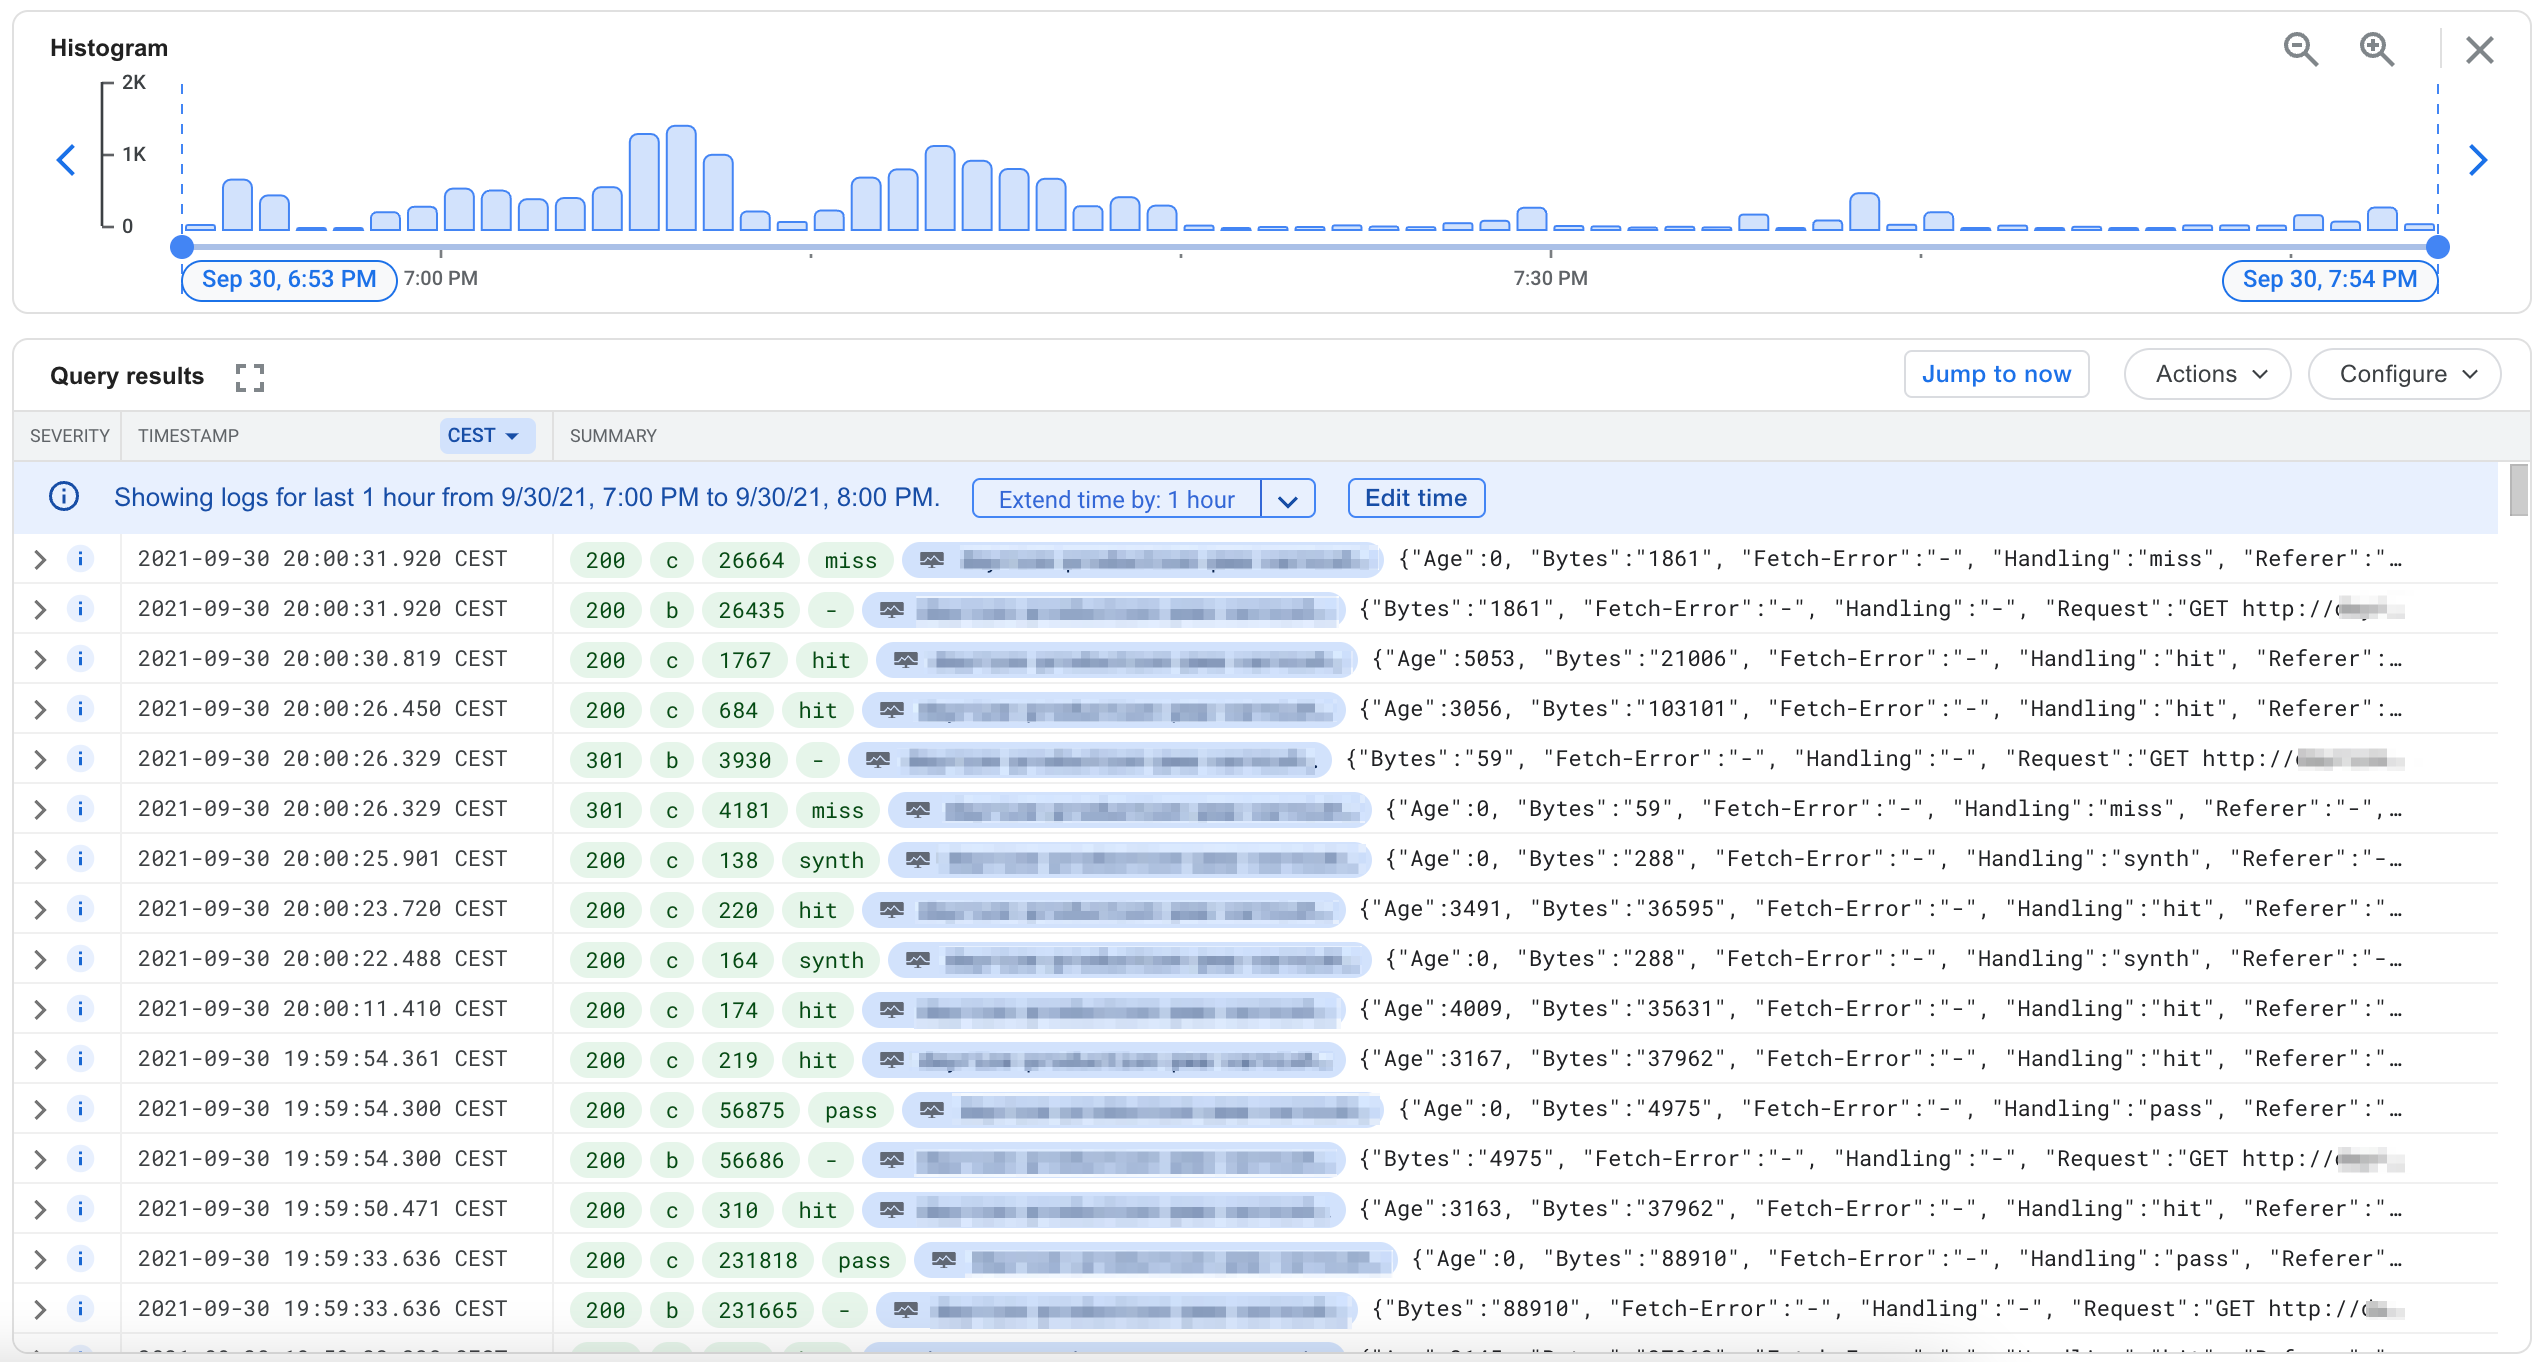
Using these examples we can get the following JSON output which can be examined in GCP Logging.
If we pin the Status, the Varnish-Side, the Time-To-Serve (in microseconds), and the Handling fields and we will get a really useful Dashboard.
Varnishhist, varnishstat, varnishtop #
These tools can become handy when you want to get statistics about the running Varnish instance. They read the Varnish shared memory logs and generate some output for you.
varnishhist: shows you a histogram of the last requests.varnishtop: presents a continuously updated list of the commonly occurring log entries.varnishstat: displays statistics, like hit/miss rate, evictions, etc..
Frequent Errors #
Header Size exceeded #
BogoHeader Too many headers
FetchError http read error: overflow
By default Varnish will allocate 8KB memory for HTTP Headers (http_resp_hdr_len). This means any Backend Response which has larger headers than this will cause a 503 error. Sometimes it’s just not enough. If you want to increase this limit you should also increase the HTTP Response Size (http_resp_size) which is 32KB by default. To raise these limits add these two options to the DAEMON_OPTS in the varnish.params file.
- CentOS 7:
/etc/varnish/varnish.params - Ubuntu/Debian:
/etc/default/varnish
DAEMON_OPTS="... -p http_resp_hdr_len=65536 -p http_resp_size=98304"
Workspace size exceeded #
FetchError b overflow
FetchError b Workspace overflow
If you face one of these errors and you’ve already raised the http_resp_hdr_len and http_resp_size values it can be a good idea to also increase the Varnish workspace for the Backend transactions because the memory for them will be allocated from workspace_backend memory segment.
DAEMON_OPTS="... -p workspace_backend=131072"
Note 1: For efficient virtual memory allocation it is recommended to set values that can be divided by 4096.
Note 2: the same options can be configured for incoming requests using http_req_hdr_len, http_req_size, and workspace_client params.
The backend closes the connection unexpectedly #
FetchError HTC status -1
As we can find in the source code of Varnish, the HTC status -1 error code means an unexpected EOF from the backend. To find the cause of this error you will have to dive deeper. In my case, I used tcpdump and Wireshark. In the HTTP backend response, I was able to catch the custom Nginx response code. It was HTTP 444 - No Response and Varnish interpreted it as a bad response.
Further reading:
- https://varnish-cache.org/docs/trunk/reference/varnishd.html
- https://varnish-cache.org/docs/trunk/reference/varnishlog.html
- https://varnish-cache.org/docs/trunk/reference/varnishncsa.html
- https://varnish-cache.org/docs/6.1/reference/vsl.html
- https://support.magento.com/hc/en-us/articles/360034631211
- https://github.com/DataDog/the-monitor/blob/master/varnish/how_to_monitor_varnish.md